The Principal Progression of K Clusters
Mar 18, 2020
Hello dear reader,
Let me tell you a tale to chill the bone…
I was rambling and enjoying the thought of doing a large amount of morphometrics on binary images of strawberry fruit and I had dug myself into quite the hole. Holes are easy to find and easier to fall into when you aren’t paying attention. This work can be found at https://doi.org/10.1101/736397
I had already quantified a large number of images using several techniques. I had also classified the fruits using k-means clustering. However, k-means does not attempt to assign an order to the categories; it only seeks to find them.
A lot of the strawberry shape literature relies on hand classified shape categories from an arbitrarily determined ordinal scale. I had no intention of hand categorizing or ordering the categories, mostly out of laziness. I just didn’t want to do that. AT. ALL. Getting myself out of the hand classification and hand ordering is what lead me to inventing the Principal Progression of K Clusters (PPKC).
PPKC consists of a few steps:
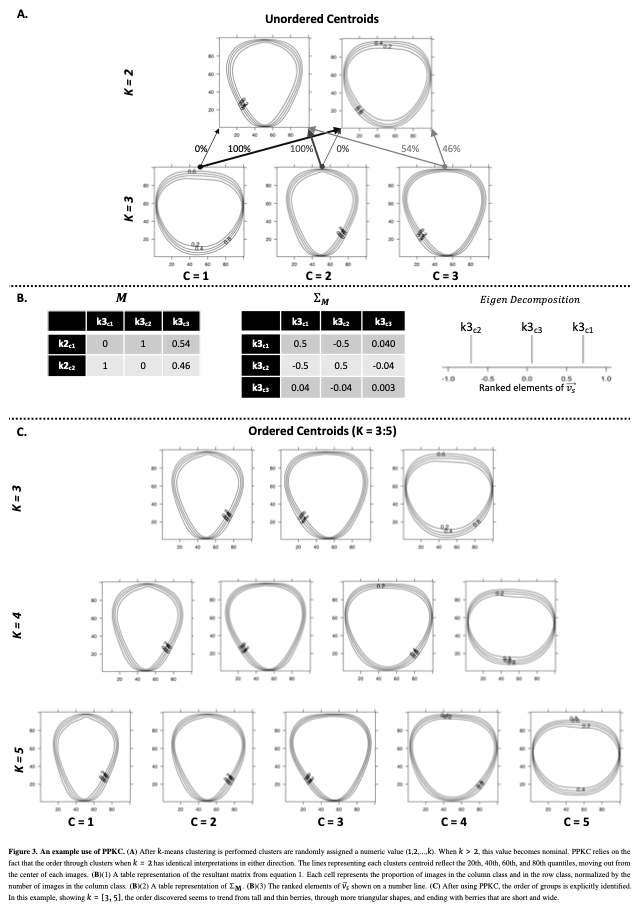
(1) Perform k-means clustering for a range of levels of “k.” If the target level is k=5, you should have k=2,…,5.
(2) Estimate the portion of each cluster at a given level of “k” that came from each previous cluster for each “k”. For any cluster when k=5, ther are 9 observations so there should be a 9 x 5 matrix.
(3) Calculate the covariance. This should be 5x5 when k=5.
(4) Eigen decompose that covariance matrix yo! I did this with prcomp() in R, but whatever.
(5) For the largest eigen value, there is an associated eigen vector with 5 elements (when k=5) that corresponds to the rows (or columns) of the covariance matrix. Sorting the elements of the eigen vector associated with the largest eigen value is the “Principal Progression”.
The code looks like this:
PPKC=list()

for( i in 2 : ncol( dat )){
        lev = levels( dat [, i ])
    prev = c(1 : ( i-1 ))
    n = (( i )^2 + ( i ))/ 2 -1
    x = c()
    for( j in 1:length( lev )) {
        for( k in 1:max( prev )) {
            y = table(dat[which(dat[,i] == lev[j]),k]) / length(which(dat[,i] == lev[j]))
            x = c(x,y)
        }
    }
    M = matrix( x, ncol=i+1, nrow=n)
    CM = as.data.frame( cov( M ))
    PPKC[[ i-1 ]] = sort( prcomp( CM )$rotation[ , 1 ], decreasing=F)
}
where:
> 'dat' is a data.frame() which objects as rows, and the columns are differeny vaues of "k."

> 'lev' is the number of levels of a given value of "k" (i.e., k)

> 'prev' is a vector containing all values of "k".

> 'n' is how many clusters there are in all previous levels of "k"

> 'M' is our n x k matrix

> 'CM' is the covariance matrix on M

> "PPKC" is the Principal Progression of K Clusters
On a 2015 MBP 2.9 GHz Dual-Core Intel Core i5 and 8 levels of K to sort, this exercise takes ~0.2s-ish or something like that… it is in the paper.
For the data presented in this data, we are able to order categories (at least they visually make sense) up to k=8, when the optimal number of categories is k=4. Plenty of evidence of overfit. So, I am pretty excited about that. We didn’t test this method on any other data sets, but I assume with enough data and enough “true” categories, this approach would work. However, I assume that if a “true” path exists with a bubble, or bifurcation, this approach would fail as it assumes that there is a single linear path between two categories.
That is the PPKC… I think it is kind of cool…
It is important to KISS (Keep It Simple, Stupid).
Best, Mitchell
PS. Dr. Pat Brown is partially to blame for this idea and Dr. Amy Tabb is responsible for calling out my horrible first draft notation.